Key points

  • Subsoil constraints affect productivity across 60% of Australia’s 20 million hectares of cropping soils. Investigations to ameliorate these constraints have led to mixed results and there are questions as to why different treatments have either worked or not.
  • Conventional techniques for investigating treatment effects use single-point-in-time destructive sampling and often do not link changes in soil condition to a plant response in an environment. Advances in logging and sensing technologies now allow continuous, non-destructive monitoring of multiple soil, plant and weather properties.
  • In 2023 and 2024, sensors at three field sites measured crop water use and determined soil water retention curves at several depths in the soil. In 2024, canopy temperature of the crops was also measured at one of these sites. This showed how plant water status responded to the amount of water available in the soil.
  • Continuous monitoring of soil water content at two sites showed how different soil amelioration strategies improved plant available water capacity. Pairing soil water content with soil water potential measurements allowed in-situ soil water retention curves to be determined at each monitored depth. This showed where in the soil profile the treatments changed pore size distribution, and by how much.
  • Measuring canopy temperature alongside soil water content and soil water potential is expected to improve the modelling and prediction of plant responses to subsoil amelioration across climates with different evaporative conditions.
Soil CRC Burramine site collaborators. Left to right; Abe Gibson (Southern Cross University), David McKenzie (Soil Management Designs), Jane McInnes (Riverine Plains), Sam North (formerly of NSW DPIRD), Alice Melland (UniSQ), Nathan Lawless (host farmer). August 2024. Photo credit: Riverine Plains.

The challenge

Plant available water capacity (PAWC) is the amount of water a soil can store in the root zone between the wettest limit for crop growth (the drained upper limit, DUL) and the driest limit for crop water extraction (the crop lower limit, CLL). Since the early 2000s, much effort has gone into removing subsoil constraints to increase PAWC so that roots can access more stored water. However, yield gains have been inconsistent, partly because the effect of treatments on PAWC has been hard to measure.

Measuring water content at the DUL and CLL gives the PAWC, but it does not show how hard it is for plants to extract water from the soil between these two limits. This information is needed to fully identify how soil constraints impact plant water supply. When water is harder to extract, plants take up and transpire less water than they need. As a result, crop growth does not reach its potential, even while the soil still holds water it can use.

A soil water retention curve (SWRC) describes how hard it is for plants to “suck” water from a soil (i.e. the soil water potential) at any given water content. In wet soil, water sits in large pores, and a plant needs little energy to draw it into its roots. As the soil dries, the remaining water is held in progressively smaller pores, at greater suction, and the plant must work harder to extract it. The SWRC is measured in two main ways:

  1. In the laboratory, using soil cores taken from different depths in the soil at a single point in time (which disturbs the soil and affects the results).
  2. Estimated from field measurements of DUL and CLL using calibrated soil moisture sensors.

Pairing water potential sensors and water content sensors allows the SWRC to be measured in the field, continuously, and under a growing crop. This produces a SWRC that shows how hard it is for plants to extract water from the soil as it dries. Field conditions capture the combined effects of soil, plant and weather on soil water dynamics. This method may therefore be a better way to identify how soil amelioration affects plant water use across the full range of plant available water and over time, as well as the effect on crop growth and yield.

Our research

This project tested a field method to characterise how easily plants can access soil water (the SWRC) and how much water the soil can store for plants (the PAWC). The method was tested at three sites, each with a history of management aimed at overcoming soil constraints (Table 1).

At each site, paired sensors were installed at 5, 10, 20, 30, 40, 60 and 80 cm depth. At each depth, one sensor measured soil water content and a second (10-15 cm beside it) measured soil water (matric) potential. In total, 198 sensors were installed across the three sites. Data from the Hussat sensors were logged wirelessly, and all other sensors were wired to loggers. The sensors took a reading every six hours.

As the soil dried after wetting events, each pair of readings added a point to the soil water retention curve. Over the project, this built up a curve from continuous field data. The Watermark™ sensors could only read soil water potentials between saturation (0 kPa) and -220 kPa. As such, laboratory methods (filter paper and/or HYPROP/WP4C) were used to check the fitted curve. An asymmetric S shape model was fitted to the paired data as it best described the data points across all sites and depths.

Canopy temperature was also measured at the Condobolin site in 2024 to assess crop water stress, using Goanna Ag (Australia) sensors.

Table 1. The three trial sites, showing soil type, management history, the methods used to measure the soil water retention curve and the length of monitoring at each.
Location Soil and constraints Management history SWRC data capture methods Period
Burramine, Victoria Brown Sodosol

Acidic topsoil

Compacted & dispersive (sodic) through much of the profile
Summer fallow three-species cover crops since 2019 Field:
Paired sensors - Irrometer Watermark™ (soil water potential)
Entelechy EnviroPro (subsoil water content)
DeltaT Wet150 (topsoil water content)

Lab:
Meter Group
HYPROP/WP4C
Filter paper
Mar 2023 to Dec 2024
Armatree, NSW Red Sodosol

Acidic, compacted & dispersive (sodic) topsoil

Strongly alkaline and dispersive subsoil
Surface gypsum/lime, deep gypsum applied in 2019
Deep elemental sulphur + surface and deep organic matter applied in 2019
Field:
Paired sensors - Irrometer Watermark™ (soil water potential)
EnviroPro (subsoil water content)
DeltaT Wet150 (topsoil water content)

Lab:
Meter Group
HYPROP/WP4C
July 2023 to Nov 2024
Condobolin, NSW Brown Vertosol

Acidic, dispersive topsoil

Compacted, dispersive (sodic) subsoil
Surface lime/gypsum in 1988 Field:
Paired sensors - Irrometer Watermark™ (soil water potential)
Entelechy EnviroPro (subsoil water content)
DeltaT Wet150 (topsoil water content)

Lab:
Filter paper
Sept 2024 to Nov 2024

The field-derived curves were compared against two established laboratory methods:

  • HYPROP/WP4C. An intact soil core (75 mm diameter; 50 mm high) is wetted then left to dry. The HYPROP test measures how much water the soil loses and how tightly the remaining water is held. The WP4C measures the matric potential of dry samples of loose soil.
  • Filter paper method. A filter paper with known water-holding properties (Whatman 42) is sealed with a soil sample until both reach the same moisture content. The water then held in the paper shows how tightly the soil held its water.

At each site, the treated plots were compared with an untreated control to test whether the treatment had changed the SWRC and/or the PAWC.

Figure 1. Soil water retention curves obtained using paired soil water content and matric potential sensors at five depths in a sodic brown vertosol under a wheat crop at Condobolin. Vertical dashed lines indicate the drained upper limit (DUL= -10 kPa), the readily available water (RAW) limit (-80 kPa) and crop lower limit (CLL= -1500 kPa). The difference between the DUL and CLL is the plant available water (PAW). Horizontal dashed lines from the RAW limit to the Y-axis indicate the amount of soil water at each of the five depths when the wheat experienced water stress as the profile dried. (Note – matric potential is a negative value but is plotted as a positive number for ease of interpretation).
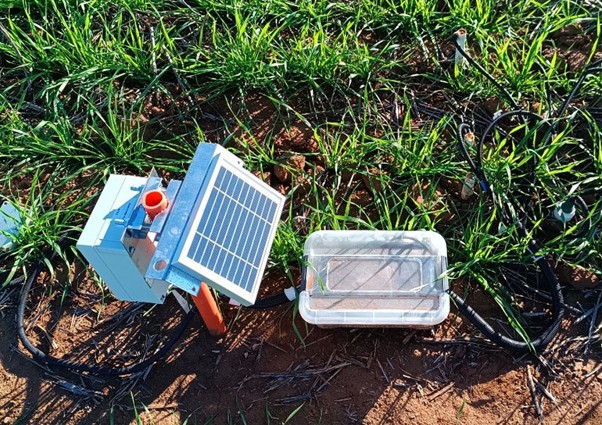
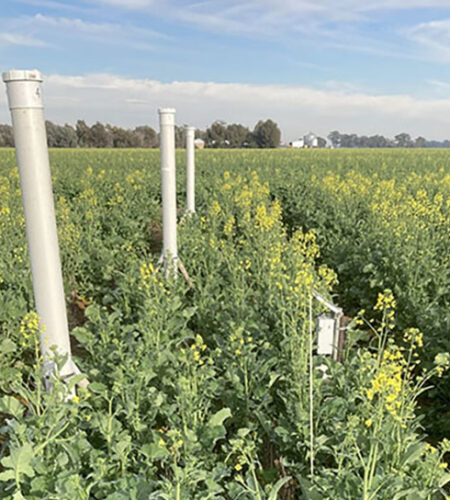
Left to right: Logger, solar panel and wiring junction box for soil water content and matric potential sensors (top right) at Armatree, NSW. June 2024. Photo credit: J. Eberhard, UniSQ

Research findings

Measuring soil water dynamics in the field

The paired sensor field method successfully characterised soil water dynamics in the field soils. Using the technology also provided some lessons and led to improvements in the method.

One major research goal at the Burramine and Armatree sites was to compare the field method against the older and more established laboratory methods.

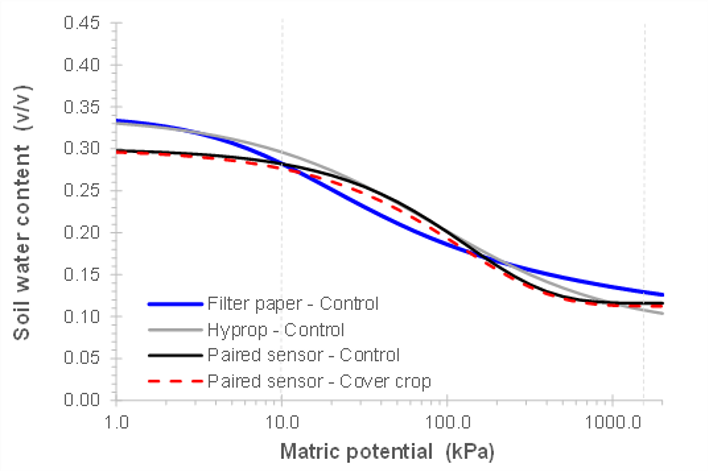
At Burramine, the curves fitted to the field method data closely matched the curves from both laboratory methods in the topsoil at 10 cm (Figure 2, top). However, the field and laboratory curves differed at 30 cm (Figure 2, bottom). The PAWC estimates in the control soil (0-85 cm depth) were 109 mm (field method), 105 mm (filter paper) and 85 mm (HYPROP/WP4C).

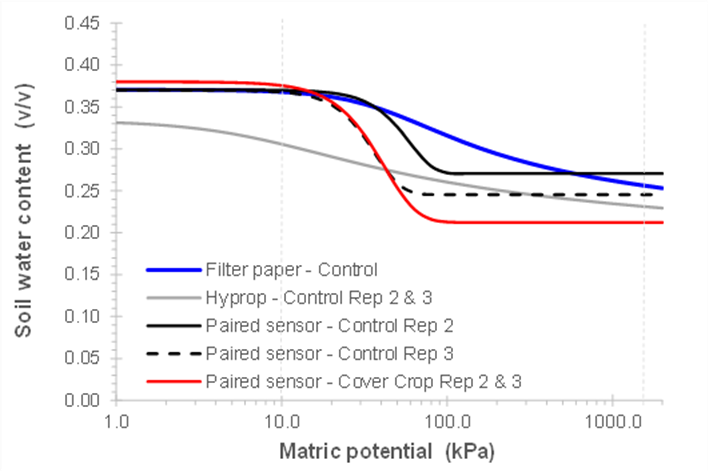
At Armatree, the field and laboratory curves were also similar in the topsoil (10 cm) but differed in the subsoil (30 cm). As a result, PAWC estimates in the control soil (0-105 cm) were markedly different, with the field method PAWC (136 mm) roughly half the PAWC from the HYPROP/WP4C laboratory method (222 mm and 298 mm).

The differences between the field and laboratory curves are attributed to the force needed to drive sampling rings into dense subsoils to collect soils for the laboratory methods. This undoubtedly affected pore distribution in these cores. At Armatree, accurate calibration of the soil sensors was also limited because there was not enough rainfall to fully wet the profile, and the site’s distance made regular visits to sample at wet and dry times difficult.

The Condobolin site was irrigated. This allowed the soil water sensors to be accurately calibrated across the full range of field water contents at all depths. Accurate SWRCs could be derived for all depths at this site (Figure 1). Unfortunately, faulty sensor wiring resulted in data loss from both plots (8 days from Bay E6; 19 days from Bay E5). The filter paper method was used to check the curves fitted to the field method data. The HYPROP/WP4C method was not used at this site.

Figure 2. Fitted soil water retention curves for the topsoil (10 cm depth, top) and subsoil (30 cm depth, bottom) at Burramine developed using two lab-based methods (Filter paper and HYPROP) and one field method (paired sensor). Unless stated in the legend, curves are the mean of three replicates. (Note – matric potential is a negative value but is plotted as a positive number for ease of interpretation).

Effect of soil treatments on PAWC

Burramine, VIC

Summer cover cropping increased PAWC in the subsoil by about 30 mm. There was no difference in PAWC in the topsoil between the cover crop and the fallow control.

The higher PAWC in the subsoil under the cover crop was attributed to more pores at the top of the subsoil, which may be due to more roots at this depth and/or more soil drying (from plant water uptake) creating cracks. As a result, the wheat in the summer cover crop treatment used more water during grain filling in 2024. Its yield was higher, in line with the extra water used, but the difference was not significant.

After harvest, the soil profile in the summer cover crop treatment was drier. The cover crop then used more water while growing in February. Together, this left the subsoil in this treatment drier at sowing, which led to poorer establishment and lower early growth of the canola in 2024. Despite this, canola yields were not significantly different, because late winter rain allowed the canola in the summer cover crop treatment to recover.

Armatree, NSW

Sodic soil amelioration improved crop root growth and water use. In 2023, lupin roots grew to a maximum depth of 85 cm in the control and 100 cm in the treated soil. In 2024, a wet year, wheat roots grew to 100 cm in the control and 120 cm in the treated soil.

Crops used more water in the treated soil. In 2023, lupins used 6-24 mm more water than in the control. In 2024, wheat used 20 mm more water in treated soil than in the control. In the treated plots, reduced compaction in the upper subsoil may have allowed roots to grow deeper, while improved structure lower in the profile gave them a better environment to grow in.

The PAWC predicted from the field method did not reflect the observed differences in water use among treatments. This variability may be partly due to limitations of the sensors and logger setup when the soil was very dry.

Condobolin, NSW

At Condobolin, the historic lime and gypsum application showed no clear effect on PAWC. There was no difference in PAWC between the treated (Bay E6) and untreated bay (Bay E5). The SWRCs were similar in the topsoil but differed at depth. However, the plots were not replicated so these differences could not be attributed to any treatment effect. Soil chemistry indicated exchangeable sodium was lower in the untreated plot, suggesting no lasting effect to depth from the lime and gypsum applied over 30 years earlier.

Concurrent measurement of water content, water potential and canopy temperature

The Condobolin site was surface irrigated, meaning the timing of soil wetting and drying could be controlled. Soil sampling could be planned for when profiles were fully wet or dry, which greatly improved the precision and accuracy of the sensor calibrations and the reliability of the water content readings. Canopy temperature sensors were also installed to link soil water status to crop water status.

Pairing water potential with water content allows the readily available water (RAW) range to be measured. RAW is the water plants can take up as fast as they need it. Within this range, stomata stay open, plants do not wilt, and photosynthesis, light capture and root growth continue without restriction. Below the RAW limit, water is still available but harder to extract, and crop growth slows.

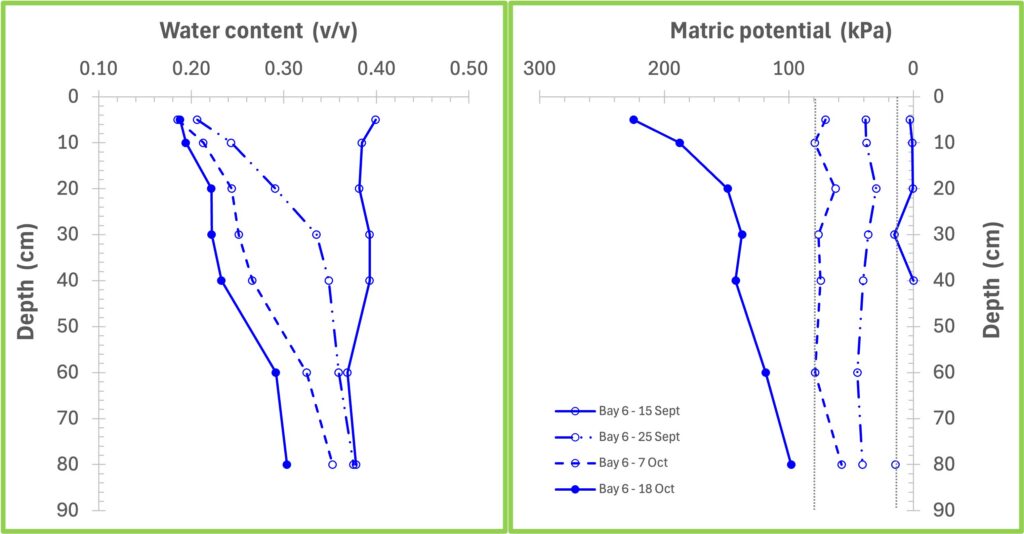
After irrigation on 13 September 2024, soil water potential decreased evenly down the profile while water was freely available (0 to -80 kPa) (Figure 3, right). This would not have been seen if only water removal from the profile had been measured (Figure 3, left). The differences between the two plots in Figure 3 may be due to root density, which is affected by the increasing weight of soil with depth.

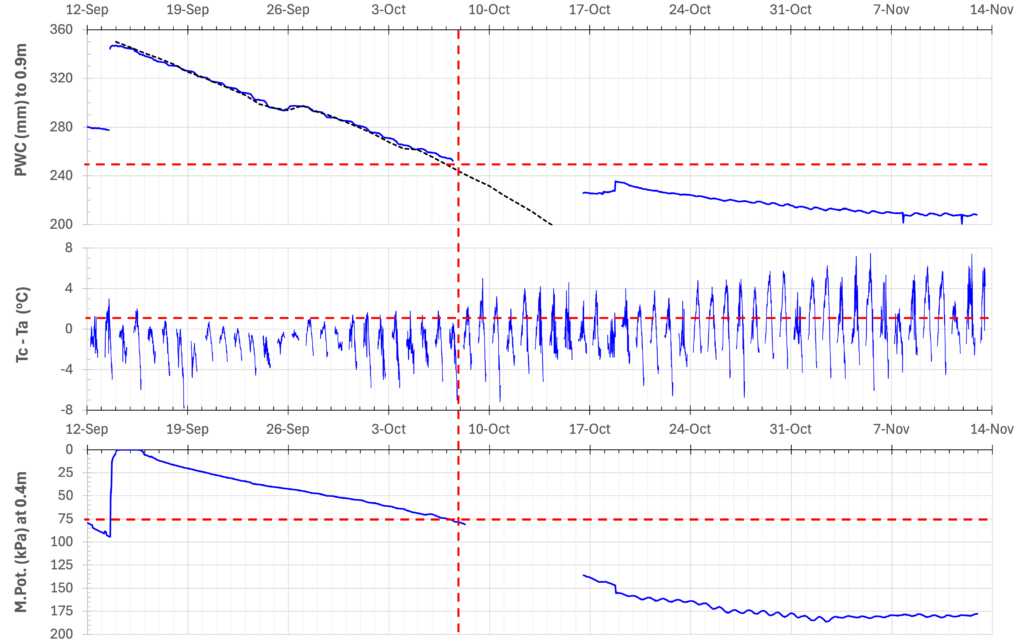
Figure 4 shows how the RAW limit was estimated. Actual crop water use was measured from the daily change in profile water content (PWC) to 0.9 m and compared with potential water use calculated from evapotranspiration (ETo). Around 8 October, the crop began using less water than its potential (Figure 4, top). Canopy temperature confirmed this, with the crop becoming more than 2 °C warmer than the air after this date, as plants closed their stomata to save water (Figure 4, middle). At this time, soil water potential at the bottom of the active root zone (40 cm) was about -75 kPa (Figure 4, bottom) and was similar at all depths in the root zone. This shows that the crop could take up water easily until the soil reached about -80 kPa. Readily available water was therefore defined as the water held between -10 and -80 kPa (Figure 1). In the top 0.9 m of soil, this was about 100 mm of water: the profile held 350 mm when wet and 250 mm when the crop became stressed (Figure 4, top).

Pairing water content and water potential measurements also allows the SWRC to be measured for every soil horizon. When the RAW is added to SWRCs (which automatically allow prediction of DUL and CLL), then horizons within the profile that are limiting to plant water use can be easily identified. This is illustrated in Figure 1, which shows that there is less readily available water as a proportion of PAWC at the 10 and 20 cm depths. This shows where soil constraints lie in this profile, so amelioration can be better targeted and treatment effects assessed.
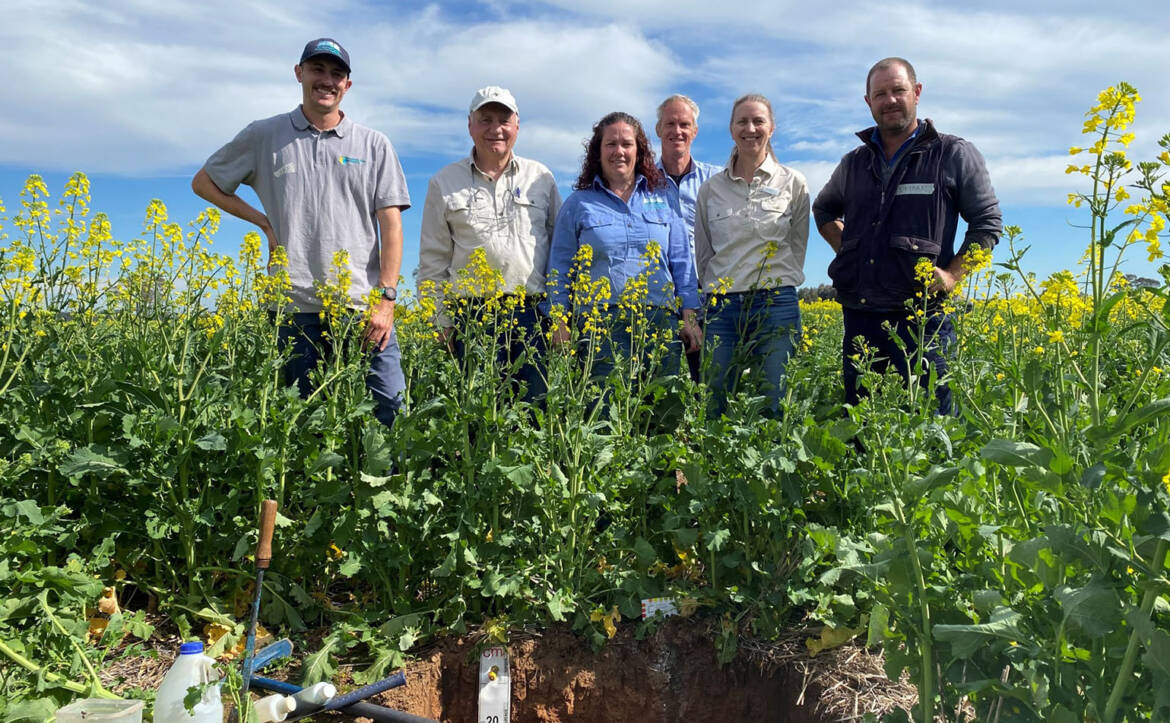
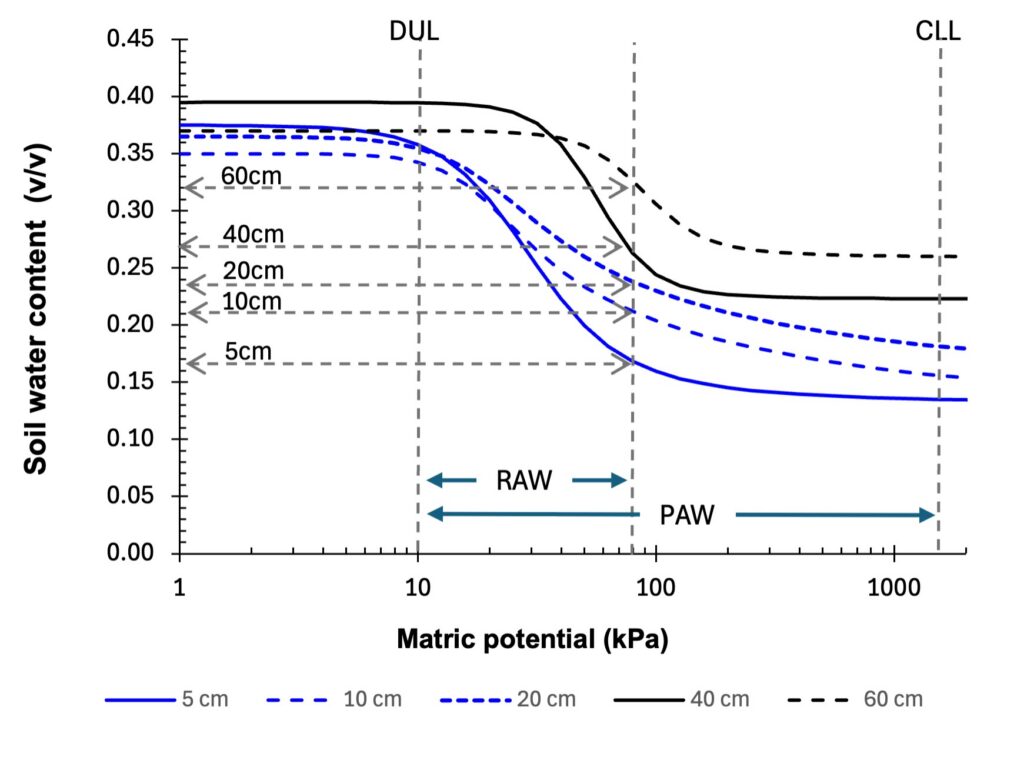
Figure 3. Volumetric water content (left) and matric potential (right) at monitored depths down the profile in Bay E6 at Condobolin at four times during the drying period following surface irrigation on 13 September 2024.
Figure 4. The top graph shows the profile water content (PWC - blue line) in the top 0.9 m in Bay E6 at Condobolin in 2024 plotted against the potential crop water use. The middle graph shows the difference between canopy and air temperature (Tc-Ta; oC) of the wheat in Bay E6. The bottom graph shows the matric potential (kPa) at 0.4 m depth in Bay E6 over the same time period. The vertical red, dashed line indicates 8 October, which was the day actual crop water use < potential crop water use, Tc-Ta exceeded 2 oC at midday, and matric potential at the bottom of the active root zone exceeded 75 kPa. (Note – matric potential is a negative value but is plotted as a positive number for ease of interpretation).

Significance of the findings

This project applied and evaluated a new field method for measuring the SWRC, establishing where the paired sensor approach performs well and where it is limited. It also indicates how crop models might be improved. Rather than treating PAWC as a fixed value, these models could use a field-measured retention curve to better represent resistances to plant water extraction through the season.

Measuring soil water in this way improves our understanding of how soil water supply changes through the season and how soil amelioration can change soil water dynamics. In the future, this knowledge will help farmers and advisers assess where soil amelioration is needed and whether it is worth the cost in their climate. This would support the grain industry’s resilience to climate variability and change.

The project also produced three field datasets of soil water dynamics on ameliorated soils, giving farmers and researchers a record of how these specific amelioration practices affect soil water at the sites and soil types studied.

Next steps

Crop production models should be refined to represent soil water dynamics more mechanistically, then validated against field data to confirm they can predict how changed soil management affects productivity. Once such models are available, the field method and the models could be used together to estimate the value of ameliorating a given soil constraint, including under projected future climates.

The method could also be applied during periods of crop stress, when it can show not only how much water a crop is using but also which constraint is most limiting to production, helping to guide the choice of practice change to overcome it.

Finally, the method should be extended beyond the dryland, water-limited conditions examined here. Applying it at sites prone to waterlogging or salinity would characterise the wet end of the retention curve and the effect of osmotic pressure on plant growth, respectively, which this study could not address.