This fact sheet supports the ‘Thinking about a soil carbon project?’ webinar, delivered as part of ‘Soil carbon capacity building resources for farmers and advisors’ project, proudly supported by the NSW Department of Climate Change, Energy, the Environment and Water (DCCEEW).
In this webinar, Dr Karl Andersson (NSW DPIRD) and Dr Brian Murphy (NSW Soil Knowledge Network) consider and interpret the landscape and soil data to understand and inform soil carbon sequestration potential.
Key messages
- Soil Organic Carbon (SOC) = the organic carbon component of soil organic matter (SOM).
- Essential to know initial levels of SOC and how they relate to expected levels of SOC for a range of land types and management practices.
- Most SOC occurs in the top 30 cm of the soil profile.
- Increases in SOC require the input of biomass into the soil either from plants by photosynthesis, or from organic amendments (expensive).
- Decomposition of SOC in soil is continuous and therefore the increase in SOC and the maintenance of SOC requires the continual input of biomass into the soil.
- Increases in SOC in soils do reach an equilibrium level (also referred to as the soil organic carbon storage ceiling) depending on a number of factors. The time to reach the equilibrium depends on the difference in SOC between the initial SOC level and the equilibrium level of SOC which is determined by the balance between annual inputs of biomass and decomposition rates of SOC. This is influenced by the climate, soil type and land management practices.
Measuring soil organic carbon
- Soil organic matter includes carbon (57%), oxygen. hydrogen, nitrogen, sulphur, phosphorus and small amounts of several other elements. Soil organic carbon is the component that is measured in the laboratory.
- SOC% = grams of organic carbon/100 g of air-dry soil.
- Soil organic carbon stocks (SOCm) – mass of SOC/ha/depth (usually 30 cm).
SOCm = SOC% x bulk density x soil depth x gravel correction (t/ha/depth).
Note, it is necessary to know the soil bulk density and gravel content to estimate the soil organic carbon stocks.
Soil organic carbon and soil condition/soil health
Soil organic carbon influences a range of soil properties:
- chemical – buffers pH, binds heavy metals
- physical – improves soil structure stability, water holding capacity, buffers soil temperature
- biological health – energy for biological processes, nutrient stores and cycling, resilience.
Improved soil health/soil condition by increasing levels of SOC% is potentially valuable, increasing soil productivity
- Historically, the original levels of SOC under native vegetation have been reduced under agriculture, and especially under cropping. Some recovery is possible with modern, improved land management practices, especially under pasture.
- Recently, various projects on soil organic carbon have identified how much soil organic carbon can be stored in soils in a range of different soils and climatic zones using common land management systems (Chan et al. 2011; Baldock et al. 2013).
- SOC in soils is dynamic and behaves as a bucket with biomass coming in and SOC being continuously decomposed. Increases in SOC require a continual input to balance the output by decomposition.
Maintaining and increasing soil organic carbon (SOC)
Biomass input, usually related to rainfall and temperature, is essential to maintaining and increasing SOC.
Sources of biomass input:
- Plant photosynthesis (Net Primary Production – NPP), plant productivity, roots
- Climate – rainfall, temperature
- Soil type, geology, landform, fertility, rooting depth, water infiltration
- Agronomy, land management – grazing management, stocking rate, stubble management, tillage, and more.
- Fibrous roots, fine roots, especially near surface, plant species, grasses, perennials, root exudates are important, root to shoot ratio of plants.
- Grazing management – above and below-ground plant growth, maintaining a higher resistant biomass and productive perennial pasture species. (McDonald et al. 2023)
- Biomass from amendments – composts, biowastes, biochar, and more.
- Determine soil variability and properties, and address constraints to plant growth, and soil carbon losses (erosion, decomposition, removal).
- Manage nutrition, nitrogen availability, productivity, erosion – for the production benefits of cycling SOC and SOM.
Irrigation can increase biomass production when all other plant needs are met. A linear increase in organic carbon percentage has been observed with increasing annual rainfall for southern NSW – 1% SOC for 300mm annual rainfall to >3% SOC for 1150mm annual rainfall in 0-10cm soil. (Source: Andersson and Badgery (2010), Soil carbon levels in southern NSW 25th Annual Conference of The Grassland Society of NSW).
Constraints to biomass production
Constraints to biomass production include:
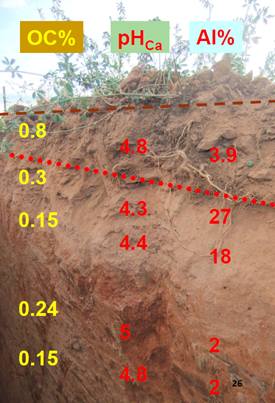
- Acidic soils pH (CaCl2) <5.5 surface and 4.8 subsoil. High Al% levels
- Hard pans – impeded roots, low water permeability, water logging
- Salinity – impeded roots, toxicity to roots
- Sodicity (>6% Sodium) – low water permeability, water logging, impeded roots, surface crusting and low infiltration if sodicity in the surface
- Low inherent fertility, low nutrient status, low nitrogen mineralisation
- Low effective cation exchange capacity – susceptible to nutrient leaching, poor soil structure
- High bulk density – low water permeability, impeded roots.
Decomposition of soil organic matter and soil organic carbon
The rate of decomposition depends on:
1. Proportions of the soil organic matter fractions in the soil –
- Labile organic matter is readily used by micro-organisms and turns over every 2 to 3 years
- Slow fraction is less susceptible to decomposition, with a turnover rate of 20 to 40 years.
- Stable or passive soil organic carbon very slowly decomposes as it is chemically protected, referring to charcoal or charcoal like compounds resistant to decomposition.
2. Soil texture –
- Clay particles and to a lesser extent silt particles, can provide small pores with sites that protect the fragments of SOC from soil organisms and inhibit or slow decomposition.
- Sandier or more coarse textured soils tend to have higher rates of decomposition and over all have lower levels of SOC.
3. Soil disturbance – tillage can increase the rate of SOC decomposition
4. Soil organic matter with a lower Carbon/Nitrogen ratio decomposes more quickly than SOM with a high C/N ratio. g. legume stubble decomposes quicker than wheat stubble. However, legume stubble can be microbially processed into stable SOC.
What might you get? An expected level of SOC? The numbers
SOC is concentrated in the soil surface and reaches an equilibrium value based on soil type, texture, fertility, climate, and productivity and the land management providing enough biomass input. This can take several years to set up so there can be a long period of SOC sequestration if the biomass input is adequate.
Table 1. General SOC contents (g/100g) considered to be low, moderate and high for soils used for crop and pasture production in areas of low and high rainfall in Victoria. Source: (Peverill et al. 1991 in Baldock and Skjemstad 1999).
|
Average annual rainfall (mm) |
Low rainfall |
High rainfall |
||
|
Crop |
Pasture |
Crop |
Pasture |
|
|
Low |
< 0.90 |
<1.74 |
< 1.45 |
< 2.90 |
|
Moderate |
0.90 to 1.45 |
1.74 to 2.62 |
1.45 to 2.90 |
2.90 to 5.81 |
|
High |
>1.45 |
> 2.62 |
> 2.90 |
> 5.81 |
Table 2. Expected values of SOC% for 0 to 10 cm for Central West NSW (Source: Badgery et al. 2013, Murphy et al. 2010).
Tablelands pasture | Slopes cropping | Slopes pasture | Plains cropping | Plains pasture | |
Low | <1.80 | < 0.90 | <1.05 | <0.66 | <0.88 |
Moderate | 2.45 | 1.25 | 1.70 | 0.85 | 1.50 |
High | >3.60 | >1.93 | >2.85 | >1.32 | >2.63 |
Soil organic carbon stocks (t/ha)
Indicative values of SOC stocks for the 0 – 30 cm soil layer are:
- 20 t to 35 t and possibly up to 40 t/ha/30 cm for cropping land use
- 35 t to 50 t/ha/30 cm for well managed pasture.
Poorly managed or overgrazed pasture can have SOC stocks fall to as low as 20 t/ha/30 cm.
Actual stocks depend on soil type, climate and land management (Chan et al. 2011; Baldock et al. 2013).
Soil carbon sequestration rates (t/ha/yr)
Annual soil carbon sequestration rates typical values are of the order of 0.20 to 0.70 t/ha/yr with the lower end being associated with improved cropping practices and the upper end with changing from cropping to pasture. Some rates of up to 1 t/ha have been recorded rarely, in association with restoring degraded soils (Gray et al 2022).
Considering a soil carbon project?
Questions/steps to consider:
- What is the climate of the site? – rainfall, and temperature long-term averages, changing patterns.
- Determine site slope, landform and management history.
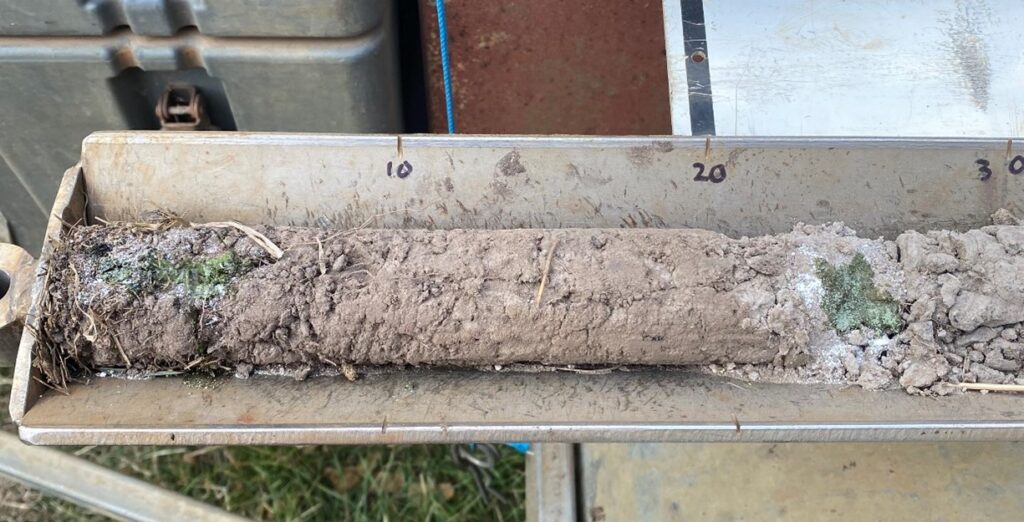
- Identify the soil type – dig a hole:
- determine the colour, texture, pH, depth to rock, rooting depth
- are there any known soil factors limiting plant growth? – soil acidity, sodicity, salinity
- Are there any historical soil tests for the paddock? e.g. pH, SOC, and to what depth?
- compare the SOC% to the benchmark values for the local area or other SOC% available.
- if the SOC level is already high compared to what is typically expected for the planned land management practices, the chance of sequestering further carbon is low.
- What land management practices are eligible for carbon credits?
- Is it possible to sequester SOC under the proposed changes in land management?
- What are the expected gross margins for the enterprises on the paddock and how do they compare to any returns from carbon trading?
- Once a soil carbon project is undertaken, measurement of SOC levels in the soil require a rigorous and costly methodology to confirm SOC levels.
Prepared by the Soil CRC and their participants as part of the ‘Soil Carbon Capacity Building Resources for Farmers and Advisors’ project, proudly supported by NSW DCCEEW.