This fact sheet supports the ‘Soil data access to inform soil carbon management’ webinar, delivered as part of the ‘Soil carbon capacity building resources for farmers and advisors’ project, proudly supported by the NSW Department of Climate Change, Energy, the Environment and Water (DCCEEW).
In this webinar, Associate Professor Peter Dahlhaus, Federation University, and Brian Jenkins and Dr Linda Henderson, NSW DCCEEW, showcase NSW online soil and land data which can be used by farmers and advisors to determine soil carbon status and potential on-farm carbon sequestration.
When managing soil carbon, it is important for land managers to understand the soil and landscape environment to maximise potential soil carbon capture.
Key messages
Soil information informs optimum soil management for productivity, soil health, sustainability, hydrology, and soil protection.
NSW soil data is collected using eDirt and data is stored in the Soil and Land Information System (SALIS) data base.
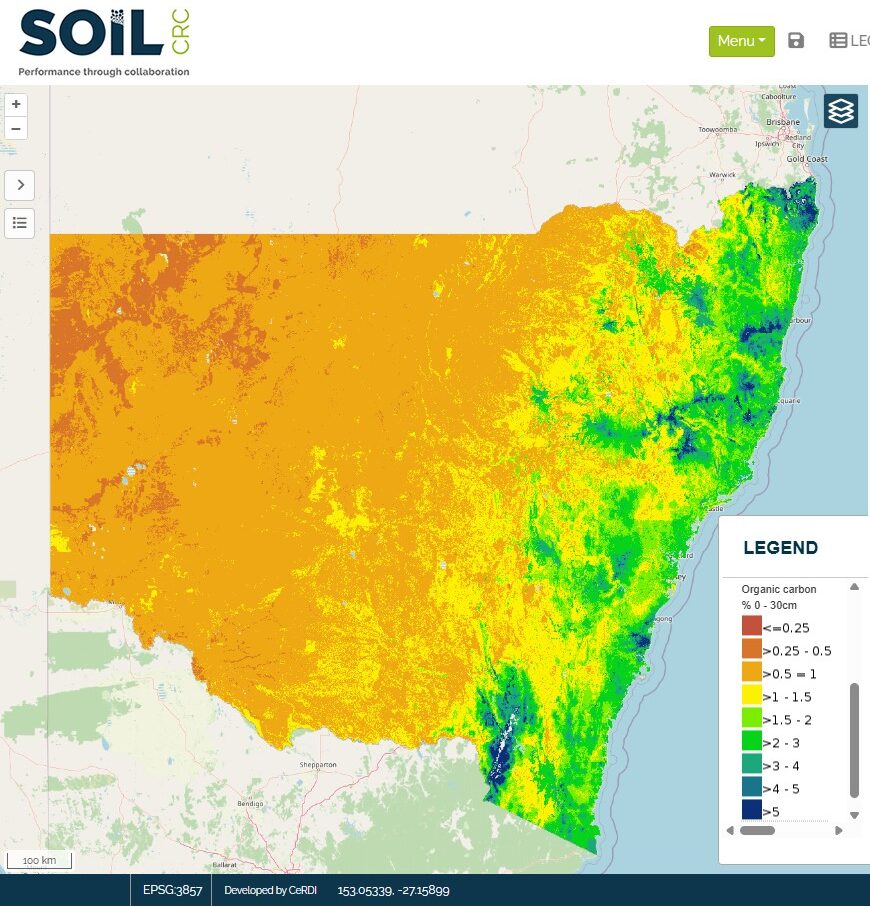
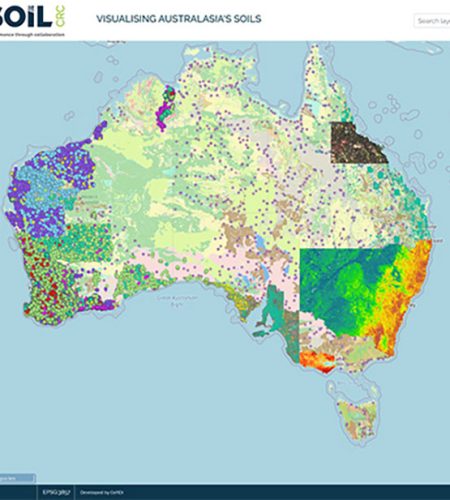
The Soil CRC’s Visualising Australasia’s Soils (VAS) portal brings together (federates) soil related datasets and information created and managed by government agencies and organisations, industry groups, community groups and individuals.
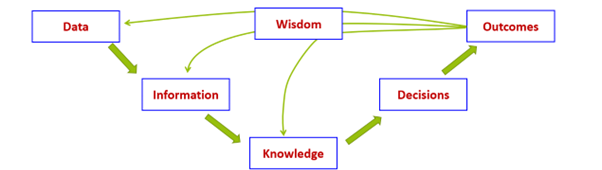
Figure 1: Better Data = Better Decisions (Source: P. Dahlhaus)
Australian Soil Classification – soil type and mineralogy will inform land use and management, and inherent soil fertility.
Inherent soil fertility – a relative indicator of the soils capacity to retain and release nutrients for plant uptake and is associated with clay and organic matter content which virtually hold all plant nutrients and largely determine soil structure which in turn affects productivity.
Land and soil capability – a framework to ensure land is managed to protect it from degradation, which may result in reduced agricultural productivity or ecosystem values, including soil carbon decline.
Identify chemical, physical and other properties which may positively or negatively impact plant production (potential to increase soil carbon) and soil carbon values (potential to retain carbon in the soil). Land management may positively or negatively influence these properties.
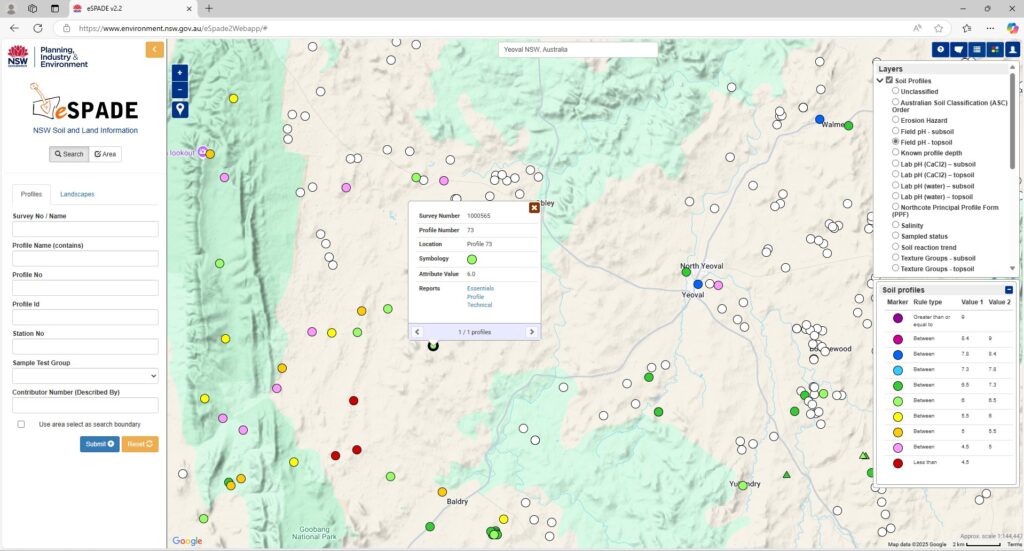
These soil properties can be found in the eSPADE soil profile layer and the statewide land and soil mapping layer, and from SEED.
Table 1. Soil properties influence
on soil organic carbon.
Property
Impact
Management example
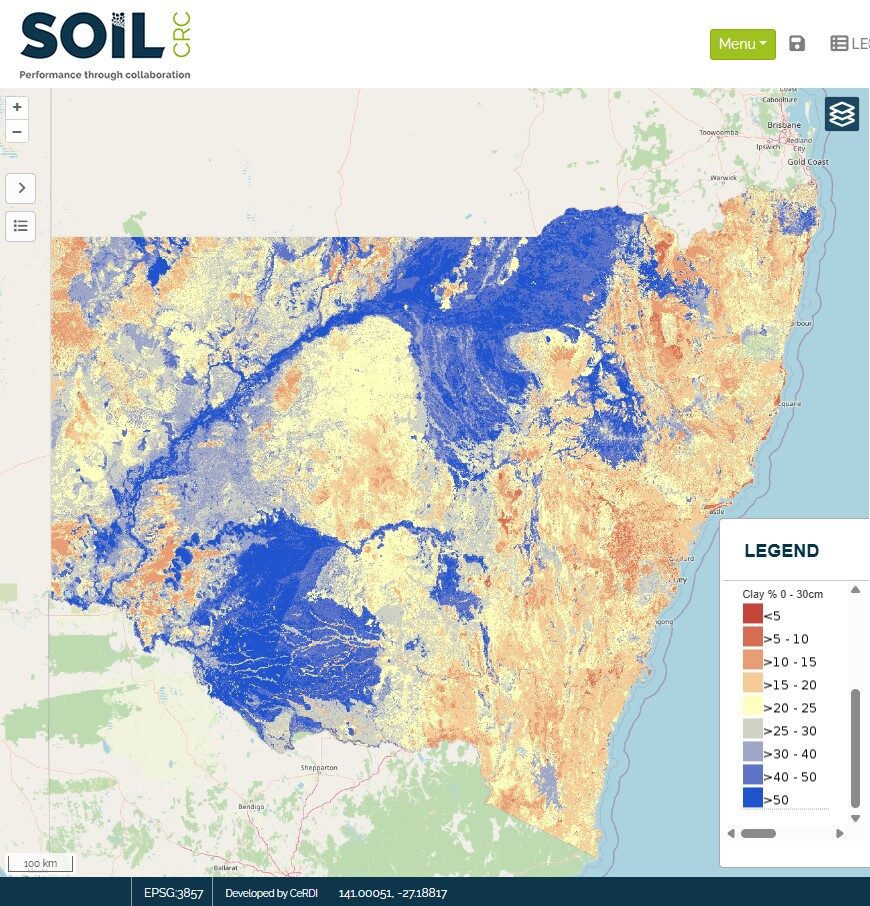
Clay percentage/
Soil texture
Influences water retention, nutrient availability, and root penetration for plant growth and soil organic carbon stability.
Add clay to coarse-textured sandy soils to improve plant growth and stabilise organic carbon.
pH
Affects availability of nutrients to plants. High soil pH will lead to deficiencies of micronutrients such as iron and
manganese, whereas low soil pH can lead to toxicities of certain elements such as aluminium.
Add lime to acidic soils (pH<5) to increase the pH.
Cation Exchange Capacity (CEC)
Measures the soil’s ability to hold and exchange cations (positively charged ions). Higher CEC indicates better nutrient retention and availability for plants.
Difficult to influence but provides guidance on carbon sequestration potential.
Access soil data to assist in assessing landscape and soil factors
Landscape information reports, accessed from the soil landscapes layer in eSPADE, by clicking on your area of interest on the map, include descriptions of land and soil attributes.
4. Soil profile reports – reporting soil features, and laboratory soil test results to determine the soil’s capacity to sequester, store and retain carbon.
Prepared by the Soil CRC and their participants as part of the ‘Soil Carbon Capacity Building Resources for Farmers and Advisors’ project, proudly supported by NSW DCCEEW.